Q: What's the difference between a Z-test and a t-test? Under which circumstances should I use one over the other?
Taken from from https://www.analyticsvidhya.com/blog/2020/06/statistics-analytics-hypothesis-testing-z-test-t-test/:
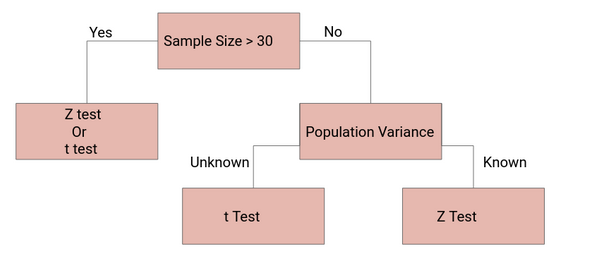
Z-Tests can be employed when:
- We know the population variance, or
- We do not know the population variance but our sample size is large n ≥ 30
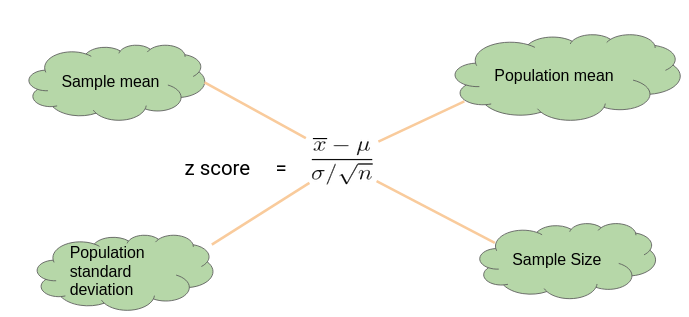
z-Test Equation:
t-tests are a statistical way of testing a hypothesis when:
- We do not know the population variance
- Our sample size is small, n < 30
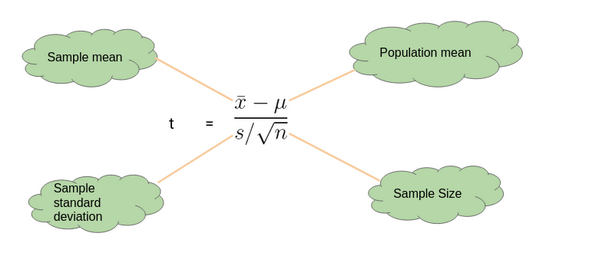
t-Test Equation:
Nifty flow-chart for which test to use when: